Dividend Data
Access 30+ years of dividend data and stock information instantly in Google Sheets and Excel, empowering your investment decisions.
Visit
About Dividend Data
Dividend Data revolutionizes the way dividend and fundamental investors access stock market information. With over 30 years of comprehensive stock market data for more than 80,000 tickers, Dividend Data seamlessly integrates into both Google Sheets and Microsoft Excel. This innovative tool was designed specifically for investors seeking immediate access to vital metrics such as dividends, yields, payout ratios, growth rates, financial statements, earnings, ratios, and price history. The main value proposition lies in its simplicity: just type a formula, and the data appears live—no coding or API keys required. Whether you're a seasoned investor or just starting your investment journey, Dividend Data equips you with institutional-grade information without the hefty price tag. With a free tier offering 2,500 monthly credits and 16 custom functions tailored for dividend investors, it stands out as an essential tool for anyone serious about maximizing their investment strategies.
Features of Dividend Data
Instant Formula-Based Data Retrieval
With Dividend Data, you can access real-time stock information by simply typing formulas into your spreadsheet. This unique feature eliminates the need for manual data entry, allowing you to focus on analysis rather than data collection.
Comprehensive Historical Data
Dividend Data provides over 30 years of historical stock data, enabling investors to analyze trends and make informed decisions based on robust historical performance. This extensive database covers a myriad of financial metrics, enhancing your investment research capabilities.
Cross-Platform Compatibility
Dividend Data is designed to work seamlessly in both Google Sheets and Microsoft Excel, ensuring that you can access critical data no matter which platform you prefer. This compatibility allows you to integrate stock data into your preferred workflow without any hassle.
Custom Functions for Dividend Investors
The tool features 16 custom functions specifically designed for dividend and fundamental investors. These functions cover everything from dividends and yields to detailed financial ratios, making it easy to pull the exact information you need for your investment analysis.
Use Cases of Dividend Data
Streamlined Investment Research
Dividend Data is perfect for investors conducting in-depth research on potential stock purchases. By leveraging its extensive data and custom formulas, users can quickly gather and analyze the information they need to make informed decisions.
Portfolio Management
Investors can use Dividend Data to track their portfolios effortlessly. By linking their investment accounts, they can access aggregate statistics and automatically monitor dividend income, enhancing their portfolio management strategies.
Educational Tool for New Investors
For novice investors, Dividend Data serves as an excellent educational resource. The intuitive formula-based interface provides a hands-on learning experience, allowing users to explore financial metrics and understand market dynamics in real time.
Automated Financial Reporting
Financial professionals can utilize Dividend Data to automate their reporting processes. By integrating dynamic stock data into their spreadsheets, they can generate accurate reports without the tedious task of manual data entry, saving time and reducing errors.
Frequently Asked Questions
What platforms does Dividend Data support?
Dividend Data is compatible with both Google Sheets and Microsoft Excel, allowing users to access stock market data on their preferred spreadsheet platform.
Is there a free version of Dividend Data?
Yes, Dividend Data offers a free tier with 2,500 monthly credits, allowing users to explore the tool without any financial commitment or trial expiration.
How do I access the data?
Accessing data is as simple as typing a formula into your spreadsheet. The tool provides various custom functions tailored for dividend investors, making data retrieval quick and efficient.
Can I track multiple stocks at once?
Absolutely! Dividend Data allows you to pull data for multiple tickers simultaneously, making it easier to analyze and compare different stocks within your portfolio.
Explore more in this category:
Similar to Dividend Data


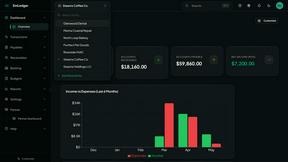
EmLedger
EmLedger delivers unified multi-entity accounting with real double-entry functionality for one flat fee, no per-entity charges.

Notesnchat
Notesnchat is the smart all-in-one app that organizes your tasks, notes, reminders, and communication to scale your daily productivity.