
Chart Echo
Chart Echo instantly finds historical chart patterns matching your current setup, showing real precedent for smarter trading decisions.
Visit
About Chart Echo
Chart Echo is a revolutionary market analysis tool that transforms how traders and investors study price action by leveraging the market's own historical memory. At its core, Chart Echo takes the exact chart pattern you are currently watching across stocks and crypto and searches through approximately 450 million historical windows to find moments that looked almost identical. This is not a predictive algorithm or a black box indicator; it is a pattern matching engine that surfaces the market's actual precedent. Once it finds these historical echoes, Chart Echo does the critical work: it overlays those past matches directly onto your current chart in gold and shows you exactly how they played out after that point. You get aggregate outcome statistics including how often similar setups rose, fell, or stagnated, the average move, and typical drawdowns along the way. The tool is built for active traders who want data before taking a setup, long-term investors who want to sanity-check breakouts against decades of precedent, and crypto watchers who understand that crypto markets rhyme hard with their own past structure. Chart Echo eliminates guesswork, vibes, and noise by giving you one clear answer to one clear question: where has this exact chart happened before, and what happened next? It is free to start with no account required, works on mobile and desktop, and is priced for real people who want institutional-grade pattern analysis without the complexity or cost.
Features of Chart Echo
Massive Historical Pattern Database
Chart Echo searches through roughly 450 million historical windows across stocks and crypto to find chart patterns that match your current setup. This is not a small sample or a curated selection; it is a comprehensive sweep of market history that captures every possible configuration of price action. The database spans multiple asset classes and timeframes, ensuring that whether you are looking at a five-minute crypto chart or a daily stock chart, the engine can find meaningful analogs. Each match is ranked by how strongly it rhymes with your pattern, so you always see the most relevant historical comparisons first.
Gold Overlay Visualization
Instead of showing you a list of tickers or abstract data points, Chart Echo overlays the historical match directly onto your current chart in a distinct gold color. This visual overlay lets you see exactly where the past pattern aligns with today's setup, making it instantly clear how the two charts compare. You can toggle between different matches and watch how each historical echo lines up with your current pattern. This feature transforms abstract statistical matching into a tangible, visual comparison that any trader can understand and act upon in seconds.
Outcome Statistics and Aggregated Data
After identifying historical matches, Chart Echo compiles and displays the actual outcomes that followed each analog. You see aggregate statistics showing the average move, the range of outcomes, typical drawdowns, and the percentage of time the setup resolved bullishly, bearishly, or went nowhere. This is not a prediction; it is the market's own recorded history organized into an honest, data-grounded probability framework. You get the full picture of what happened next across dozens or hundreds of similar setups, giving you a clear statistical edge in your decision-making.
Workspace Saving and Fractal Alerts
Chart Echo allows you to save your workspaces so you can return to any analysis later without rebuilding it from scratch. For users who upgrade to Premium, the platform adds powerful features including Pro Mode with intraday timeframes, saved-setup reminders that notify you when your favorite chart prints a strong fractal projection, and watermark-free exports for sharing professional-looking GIFs and images. The alert system ensures you never miss a critical pattern match, automatically notifying you when the market creates a setup that strongly rhymes with your saved workspace.
Use Cases of Chart Echo
Pre-Trade Pattern Validation for Active Traders
Before taking any trade setup, active traders can use Chart Echo to see the closest historical analogs and how they resolved over the following days and weeks. Instead of relying on gut feeling or generic technical analysis, you get concrete data on the odds of success, average move size, and typical drawdown for setups that looked exactly like yours. This transforms discretionary trading into a data-backed process where every entry is informed by hundreds of similar historical examples. You can quickly identify whether a breakout pattern typically follows through or fades, saving you from taking low-probability trades.
Long-Term Investment Sanity Checks
Long-term investors can use Chart Echo to sanity-check major breakouts or sell-offs against decades of precedent rather than relying on a single analyst's opinion or a news headline. When a stock breaks out to new all-time highs or crashes through a key support level, you can instantly see how similar structural moves played out historically. This gives you a grounded perspective on whether the current move is likely to continue, reverse, or consolidate. It replaces emotional decision-making with cold, hard historical data from the market's own memory.
Crypto Pattern Recognition and Cross-Asset Analysis
Crypto markets are known for repeating structural patterns with remarkable precision, and Chart Echo is built to exploit this. You can match Bitcoin, Ethereum, and other major cryptocurrencies against their own past structure and across different assets to see where today's chart has happened before. This is particularly valuable in crypto where retail sentiment often runs hot and cold; having historical precedent helps you stay objective. You can analyze everything from five-minute scalping setups to weekly trend reversals with the same pattern matching engine.
Educational Walkthrough for New Traders
Chart Echo serves as an incredible educational tool for new traders learning how markets behave. Instead of reading abstract theory about chart patterns, new users can pick any stock or crypto, run a pattern search, and see exactly how similar setups played out in real market history. The guided five-step flow walks users from selecting a market to viewing outcome statistics, making complex pattern analysis accessible to complete beginners. This hands-on learning approach builds pattern recognition skills faster than any textbook or course ever could.
Frequently Asked Questions
How does Chart Echo find matching historical patterns?
Chart Echo uses a proprietary fractal matching algorithm that takes the exact shape of your current chart pattern and searches through approximately 450 million historical windows across stocks and crypto. The algorithm compares the relative price movements, candle formations, and structural characteristics of your pattern against every historical window in its database. It ranks each match by a similarity score, showing you the closest analogs first. The entire search typically completes in seconds, giving you instant access to the market's memory without any manual scrolling or complex configuration.
Is Chart Echo a prediction tool or does it give financial advice?
No. Chart Echo is explicitly not a prediction tool and does not provide financial advice. It is a historical pattern matching engine that shows you what happened in the past when charts looked similar to your current setup. The outcome statistics it displays are purely historical data points, aggregated from actual market movements. The tool is designed to help you study precedent and make more informed decisions, but it never tells you what to buy, sell, or trade. Every user is responsible for their own trading decisions.
Do I need to create an account to use Chart Echo?
No account is required to start using Chart Echo. You can try it for free immediately without any signup. Creating a free account unlocks the ability to save your workspaces and return to them later. Upgrading to Premium adds advanced features including Pro Mode with intraday timeframes, saved-setup reminders that alert you when your favorite chart prints a strong fractal projection, intraday alerts, and watermark-free exports for sharing professional content.
What assets and timeframes does Chart Echo support?
Chart Echo supports both stocks and cryptocurrencies, covering a broad range of popular tickers and coins across major exchanges. The platform searches through approximately 450 million historical windows, giving it extensive coverage across different asset classes. The free tier includes standard timeframes, while Premium unlocks intraday timeframes for more granular analysis. You can search any supported ticker and set the number of candles that define your pattern, giving you full control over the matching process.
Pricing of Chart Echo
Chart Echo offers a tiered pricing structure designed to be accessible for all levels of traders and investors. The free tier allows you to start immediately with no account required, giving you full access to the core pattern matching engine with standard timeframes. Creating a free account unlocks workspace saving so you can revisit your analyses. The Premium tier adds Pro Mode with intraday timeframes, saved-setup reminders that alert you when your favorite chart prints a strong fractal projection, intraday alerts for real-time pattern detection, and watermark-free exports for sharing professional GIFs and images. Premium is priced for real people who want institutional-grade pattern analysis without institutional costs. Specific pricing details are available on the Chart Echo pricing page, and the platform regularly offers trials for new users to experience the full feature set before committing.
Similar to Chart Echo
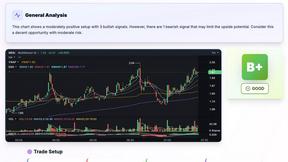

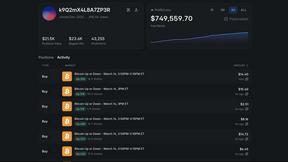
Polymarket Trading Bot For Crypto
Automate proven high-frequency crypto arbitrage on Polymarket's 5-15 minute markets with transparent, private source code you control.
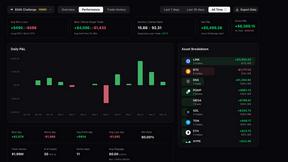
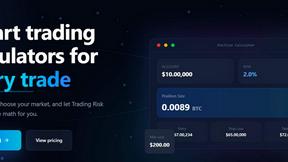
Trading Risk Lab
Trading Risk Lab eliminates guesswork from position sizing and risk management, giving you precise calculations to scale your trades and protect.
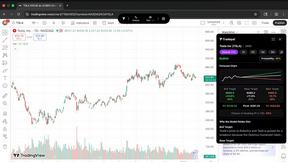
Tradepal
Tradepal transforms stock chart screenshots into actionable AI-driven insights with real-time forecasts and price.
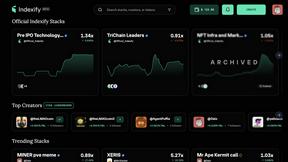
Indexify
Indexify simplifies crypto portfolio management by letting you follow experts and diversify with curated investment.
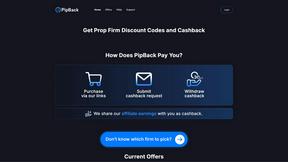
PipBack
PipBack empowers prop traders to scale by offering exclusive discounts and real cashback on tools and challenges.