Skippership vs StatPecker
Side-by-side comparison to help you choose the right product.
Skippership
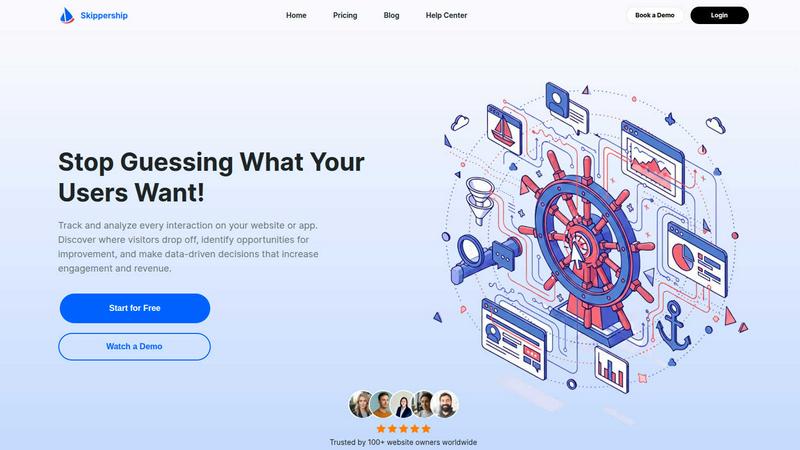
Skippership leverages AI to analyze user behavior, identify friction points, and boost engagement effortlessly.
Last updated: March 1, 2026

StatPecker
StatPecker turns your data into instant, shareable insights and stunning visuals for impactful storytelling.
Last updated: March 1, 2026
Visual Comparison
Skippership
StatPecker
Feature Comparison
Skippership
Session Replays
Session replays allow users to watch real-time recordings of actual user interactions on their website or app. This feature uncovers friction points, usability issues, and conversion blockers, enabling businesses to understand the entire user journey and make data-informed decisions to enhance user experience.
Heatmaps
Skippership’s heatmaps provide visual insights into user behavior by showcasing where users click, scroll, and spend time on various pages. This feature highlights areas of engagement and neglect, empowering businesses to optimize content and layout, ultimately boosting user interaction and conversion rates.
Goal Tracking
With Skippership’s goal tracking feature, users can easily monitor key actions such as signups, purchases, and clicks. This tool helps businesses measure performance, identify trends, and gain real-time insights into actions that genuinely drive results, leading to more effective marketing strategies.
AI Analytics
Leveraging AI-powered analytics, Skippership automatically detects patterns and user behaviors that may go unnoticed. This feature accelerates the decision-making process by providing fast, actionable insights that can enhance user engagement, improve retention rates, and yield better business outcomes.
StatPecker
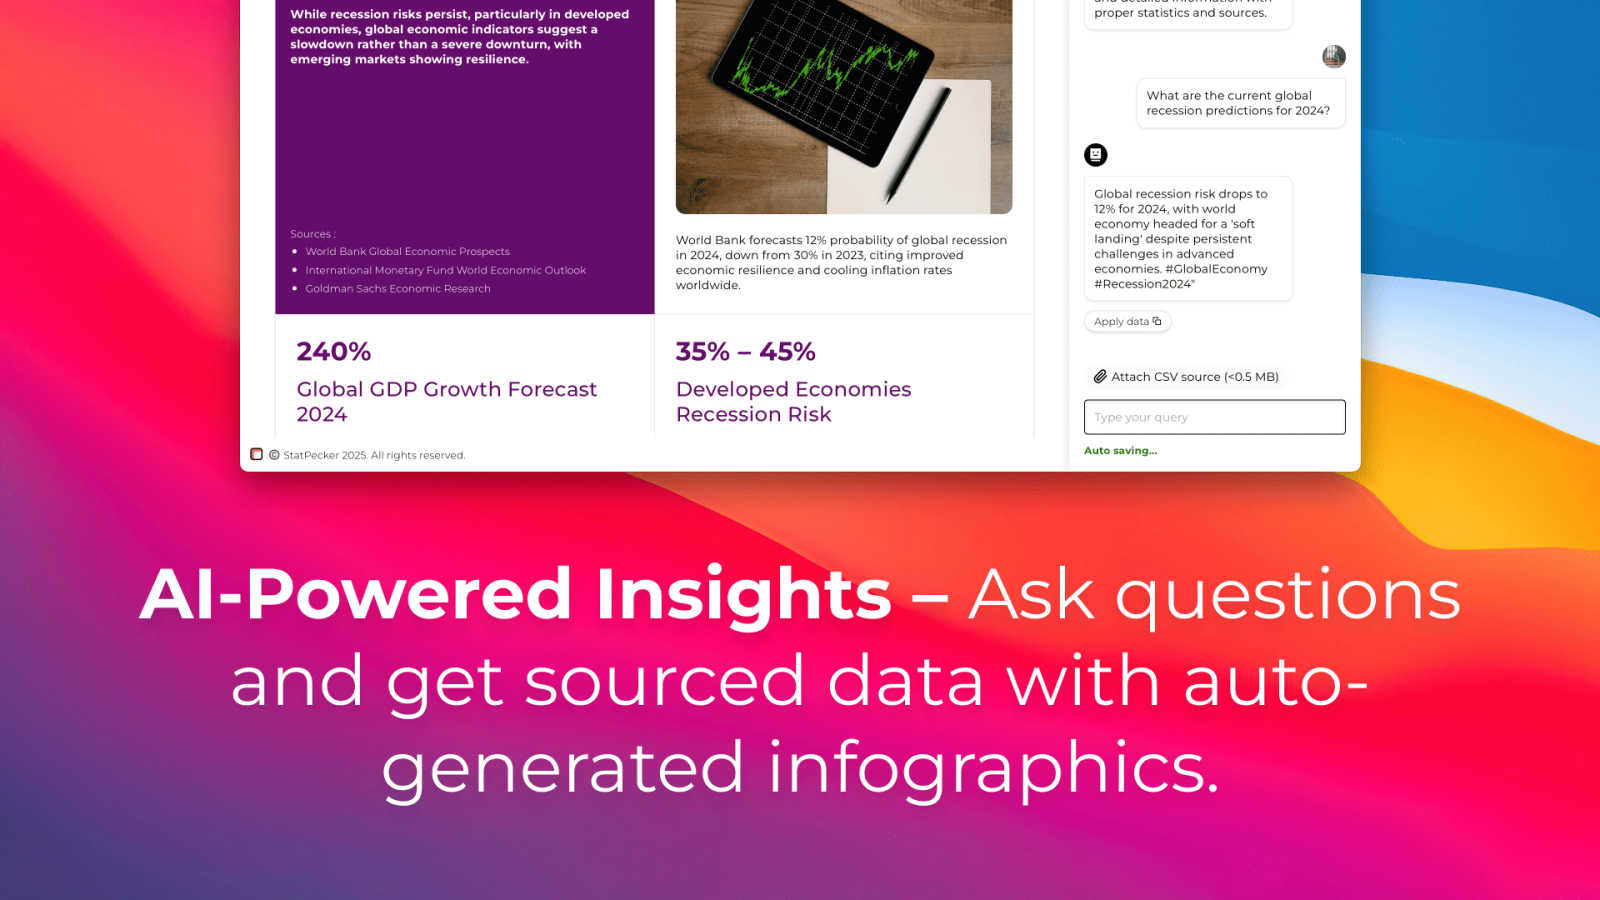
AI-Powered Query & Insights
Ask your data questions in plain English and get instant, credible insights powered by AI. This feature removes the complexity of traditional data analysis tools, allowing users to uncover trends, patterns, and answers from validated sources without any technical expertise. Simply type your question, and StatPecker generates the analysis and corresponding visuals automatically, turning curiosity into actionable intelligence in moments.
Local SQL Agent for Private CSV Analysis
Upload CSV files up to 50MB for completely private, on-device data exploration. This groundbreaking feature ensures your sensitive business data never leaves your computer. The local engine processes your queries, generates SQL, and delivers key insights as clean charts, all while maintaining total data privacy. It's perfect for analyzing sales data, customer information, or any proprietary dataset without security concerns.
Publish & Embed Interactive Visuals
Seamlessly integrate your generated infographics and charts directly into blogs, articles, websites, and reports. StatPecker creates interactive, visually engaging assets that can be embedded with a simple code snippet, enhancing content depth and reader engagement. This feature allows for dynamic data presentation that lives within your digital properties, making your storytelling more impactful and professional.
Download & Export for Any Platform
Export your data visualizations as high-quality images or assets ready for use anywhere. Whether you need graphics for a PowerPoint presentation, a PDF report, a social media post, or internal documentation, StatPecker provides flexible download options. This ensures your insights are portable and can be leveraged across all communication channels, maximizing the utility and reach of your data stories.
Use Cases
Skippership
Improving E-commerce Conversions
E-commerce businesses can utilize Skippership to identify where users drop off during the checkout process. By analyzing session replays and heatmaps, they can streamline the user journey, reduce cart abandonment rates, and ultimately drive higher sales conversions.
Optimizing Content Strategy
Content creators can leverage Skippership’s heatmaps to see which parts of their articles or landing pages engage readers. This insight allows them to optimize content placement and improve overall audience engagement, ensuring that high-value information is highlighted effectively.
Enhancing User Experience
Product teams can employ Skippership to analyze user interactions and identify pain points within their applications. By understanding where users encounter difficulties, teams can implement tailored improvements that enhance the overall user experience, leading to increased satisfaction.
Data-Driven Marketing Campaigns
Marketing teams can utilize Skippership’s goal tracking features to evaluate the effectiveness of their campaigns. By understanding which actions lead to conversions, they can refine their marketing strategies and focus on high-impact tactics that drive user engagement and growth.
StatPecker
Content Creation & Blog Enrichment
Content writers and bloggers use StatPecker to quickly find supporting data and transform it into eye-catching infographics that boost article credibility and reader engagement. Instead of using generic stock charts, they can generate unique, relevant visuals that perfectly illustrate their points, making complex topics digestible and shareable, which helps in scaling content quality and audience growth.
Business Intelligence & Internal Reporting
Analysts and team leaders leverage the Local SQL Agent to privately analyze sales, marketing, or operational CSV data. They can instantly generate visual reports on key metrics like regional revenue performance or customer trends, facilitating faster, data-driven stand-ups and strategic meetings without relying on slow, manual spreadsheet processes.
Marketing Performance Communication
Marketing professionals utilize StatPecker to create compelling campaign dashboards and performance infographics for stakeholders. By visualizing ROI, engagement metrics, and conversion data in stunning graphics, they can more effectively communicate results, justify budgets, and align teams around growth objectives with clear, persuasive evidence.
Educational Material & Presentation Design
Educators and trainers employ StatPecker to transform dry statistical information into engaging visual aids for lessons, workshops, and presentations. This makes learning more interactive and helps students or trainees grasp complex data concepts quickly, thereby enhancing the educational impact and scalability of their instructional content.
Overview
About Skippership
Skippership is a cutting-edge, AI-powered user analytics platform crafted specifically for startups and growth-oriented businesses that are eager to understand their users better. It eliminates the guesswork by transforming raw user interaction data into actionable insights that can enhance engagement, retention, and revenue. With Skippership, teams gain access to an intuitive dashboard that integrates session recordings, interactive heatmaps, goal tracking, and journey analysis, providing a comprehensive view of the user experience. The standout feature of Skippership is its sophisticated AI engine, which automatically analyzes session data to identify user pain points, such as checkout errors that lead to cart abandonment. This allows businesses to pinpoint critical issues and receive immediate suggestions for practical solutions. Designed for teams at any growth stage, Skippership ensures a no-code setup that integrates seamlessly with over 50 platforms, allowing users to make informed decisions within minutes without compromising site performance.
About StatPecker
StatPecker is an AI-powered data visualization engine designed to scale the impact of data storytelling for modern businesses and creators. It transforms raw data and complex datasets into stunning, publication-ready infographics and charts in seconds, eliminating the traditional bottlenecks of manual design and cumbersome reporting tools. Built for a growth-focused audience including content creators, data analysts, marketers, and educators, StatPecker empowers users to make data-driven decisions and communicate insights with unparalleled clarity and visual appeal. Its core value proposition lies in automating the entire visualization workflow—from AI-driven insight extraction to seamless embedding—dramatically reducing time-to-publish and operational costs. With innovative features like the on-device Local SQL Agent for private CSV analysis, StatPecker provides both instant, credible answers from validated sources and secure, private data exploration. It's more than a tool; it's a strategic asset for anyone looking to leverage data as a competitive edge, enhance audience engagement, and tell compelling stories that drive action and growth.
Frequently Asked Questions
Skippership FAQ
What types of businesses can benefit from Skippership?
Skippership is designed for growth-focused startups and businesses across various industries. Whether you are in e-commerce, SaaS, or content creation, Skippership provides valuable insights to enhance user engagement and drive revenue.
How does Skippership ensure data security and privacy?
Skippership prioritizes data security by utilizing SSL/TLS encryption and storing data on reliable cloud infrastructure. The platform is compliant with GDPR and CCPA standards, ensuring that user privacy is maintained throughout data collection and analysis.
Can I integrate Skippership with existing tools?
Yes, Skippership seamlessly integrates with over 50 platforms, including Google Analytics, Shopify, and WordPress. This allows businesses to unify their tech stack and streamline workflows without disrupting their existing processes.
How quickly can I start using Skippership?
Skippership offers a no-code setup that allows users to get started in minutes. With its intuitive interface and easy integration with other tools, businesses can begin making data-driven decisions almost immediately without sacrificing site performance.
StatPecker FAQ
How does the Local SQL Agent ensure my data is private?
The Local SQL Agent is engineered for maximum privacy. When you upload a CSV file, all processing occurs directly on your device. The data never touches StatPecker's servers. The local engine on your computer handles the query generation, SQL execution, and chart rendering. This on-device analysis guarantees that your sensitive business or proprietary information remains completely secure and under your control at all times.
What is included in the Free Tier?
The Free Tier is designed to let you scale your initial data storytelling efforts at zero cost. It includes unlimited projects and embeds (with manual edits), 25 AI queries to validated sources, and 10 CSV uploads for analysis with the Local SQL Agent. This provides substantial value for individuals and small teams to start creating professional visuals and exploring the platform's core capabilities without any financial commitment.
Can I edit the infographics after StatPecker generates them?
Yes, you maintain creative control. While AI generates the initial visual, StatPecker provides options for manual edits on embeds, allowing you to adjust colors, and labels, or highlight specific data points to better align with your brand or narrative. This flexibility ensures the final output is not only data-accurate but also perfectly tailored to your communication needs and visual identity.
What is the "Lifetime Access" pricing plan?
The Lifetime Access plan is a one-time payment of $150 (currently at a 25% discount) that grants permanent access to all current and future premium features of StatPecker. This includes unlimited AI queries, unlimited CSV uploads, unlimited projects and embeds, and priority feature requests. It's built for forward-thinking users who want a permanent, scalable solution for data visualization with no recurring subscription fees, backed by a 10-day refund policy.
Alternatives
Skippership Alternatives
Skippership is an innovative, AI-powered user analytics platform designed to empower growth-focused startups and businesses by transforming raw user interaction data into actionable insights. This platform combines session recordings, interactive heatmaps, goal tracking, and journey analysis into a single dashboard, allowing businesses to gain complete visibility into their user experience. Users often seek alternatives to Skippership for various reasons, including pricing structures, specific features that cater to unique business needs, or platform compatibility. When selecting an alternative, it’s essential to consider factors such as ease of integration, the comprehensiveness of analytics offered, and the ability to provide real-time insights that align with your team's goals.
StatPecker Alternatives
StatPecker is a dynamic AI-powered analytics and data visualization platform designed to help teams transform raw data into compelling visual stories. It empowers leaders, marketers, and creators to uncover insights and share them through stunning, embeddable infographics without requiring deep technical expertise or design resources. Users often explore alternatives to find a solution that aligns perfectly with their scaling needs. This search can be driven by specific budget constraints, the need for more advanced or niche features, or requirements for deeper integrations with an existing tech stack. As a company grows, its data storytelling and analysis demands evolve, necessitating a tool that can adapt. When evaluating other platforms, focus on core capabilities that drive growth. Key considerations include the intelligence of automated insights, the ease of embedding visuals to engage your audience, and the flexibility to work with your data sources. The right tool should not only visualize data but also integrate seamlessly into your workflow to accelerate decision-making and communication.