AskCSV

About AskCSV
AskCSV streamlines data analysis, allowing users to effortlessly interrogate CSV files for insights. The platform employs advanced AI to provide intuitive visualizations and answers, enhancing understanding while prioritizing privacy by processing data locally in the browser. It’s the ideal tool for anyone needing quick data analysis.
AskCSV offers a free tier for initial testing, while premium plans unlock advanced features and reduced limits for larger datasets. Upgrading enhances user experience with additional tools for data visualization and analysis, making it an excellent choice for professionals seeking robust insights from their data.
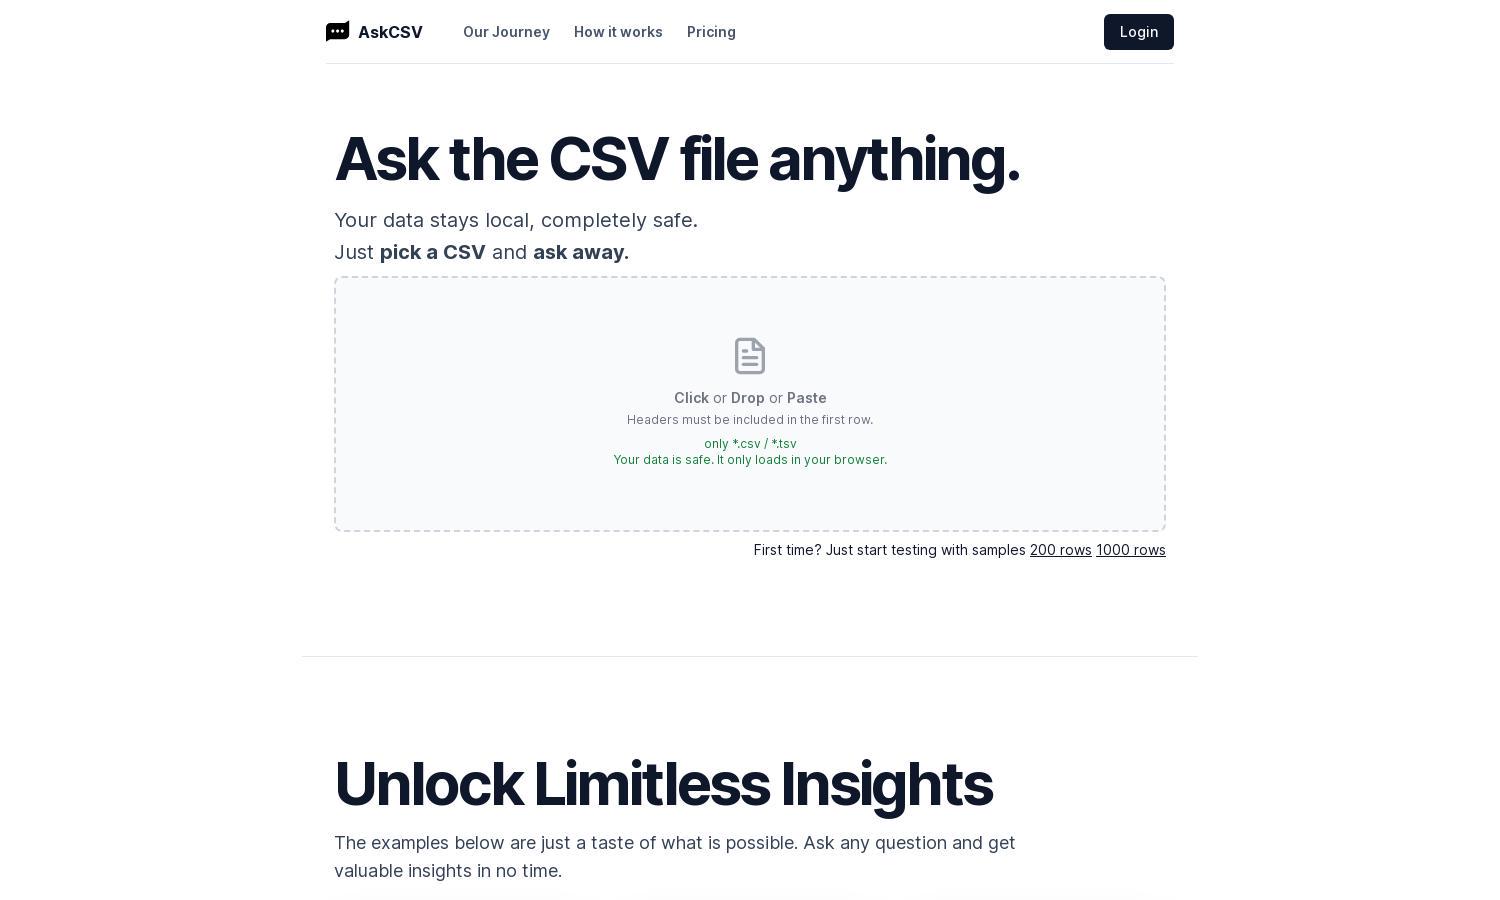
The AskCSV interface is designed for seamless navigation, featuring intuitive layout options that enhance user interaction. With drag-and-drop capabilities and user-friendly prompts, it ensures users can easily upload and analyze their data while maintaining focus on delivering clear insights and visualizations.
How AskCSV works
To use AskCSV, users begin by uploading a CSV or TSV file directly through the website. Once the data is loaded locally in the browser, they can pose questions about the dataset. The AI will respond with visualizations and insights based on the queries, making it easy to uncover trends and patterns quickly.
Key Features for AskCSV
AI-Driven Data Insights
AskCSV provides AI-driven insights that allow users to extract key information from their CSV data effortlessly. By leveraging cutting-edge machine learning algorithms, AskCSV empowers anyone to quickly visualize and analyze data trends, making data analysis simpler and more impactful.
Seamless CSV Interaction
With seamless CSV interaction, AskCSV enables users to effortlessly upload and query their data without needing specialized skills. The platform's intuitive interface and drag-and-drop features streamline the process, allowing users to conduct robust analysis quickly and effectively.
Robust Data Visualization
AskCSV features robust data visualization capabilities, allowing users to create insightful charts and graphs at the click of a button. This unique functionality helps users better understand complex data relationships and communicate insights powerfully and visually.


